Project Dashboard - Test Runs
Track and analyze test runs with the project dashboard.
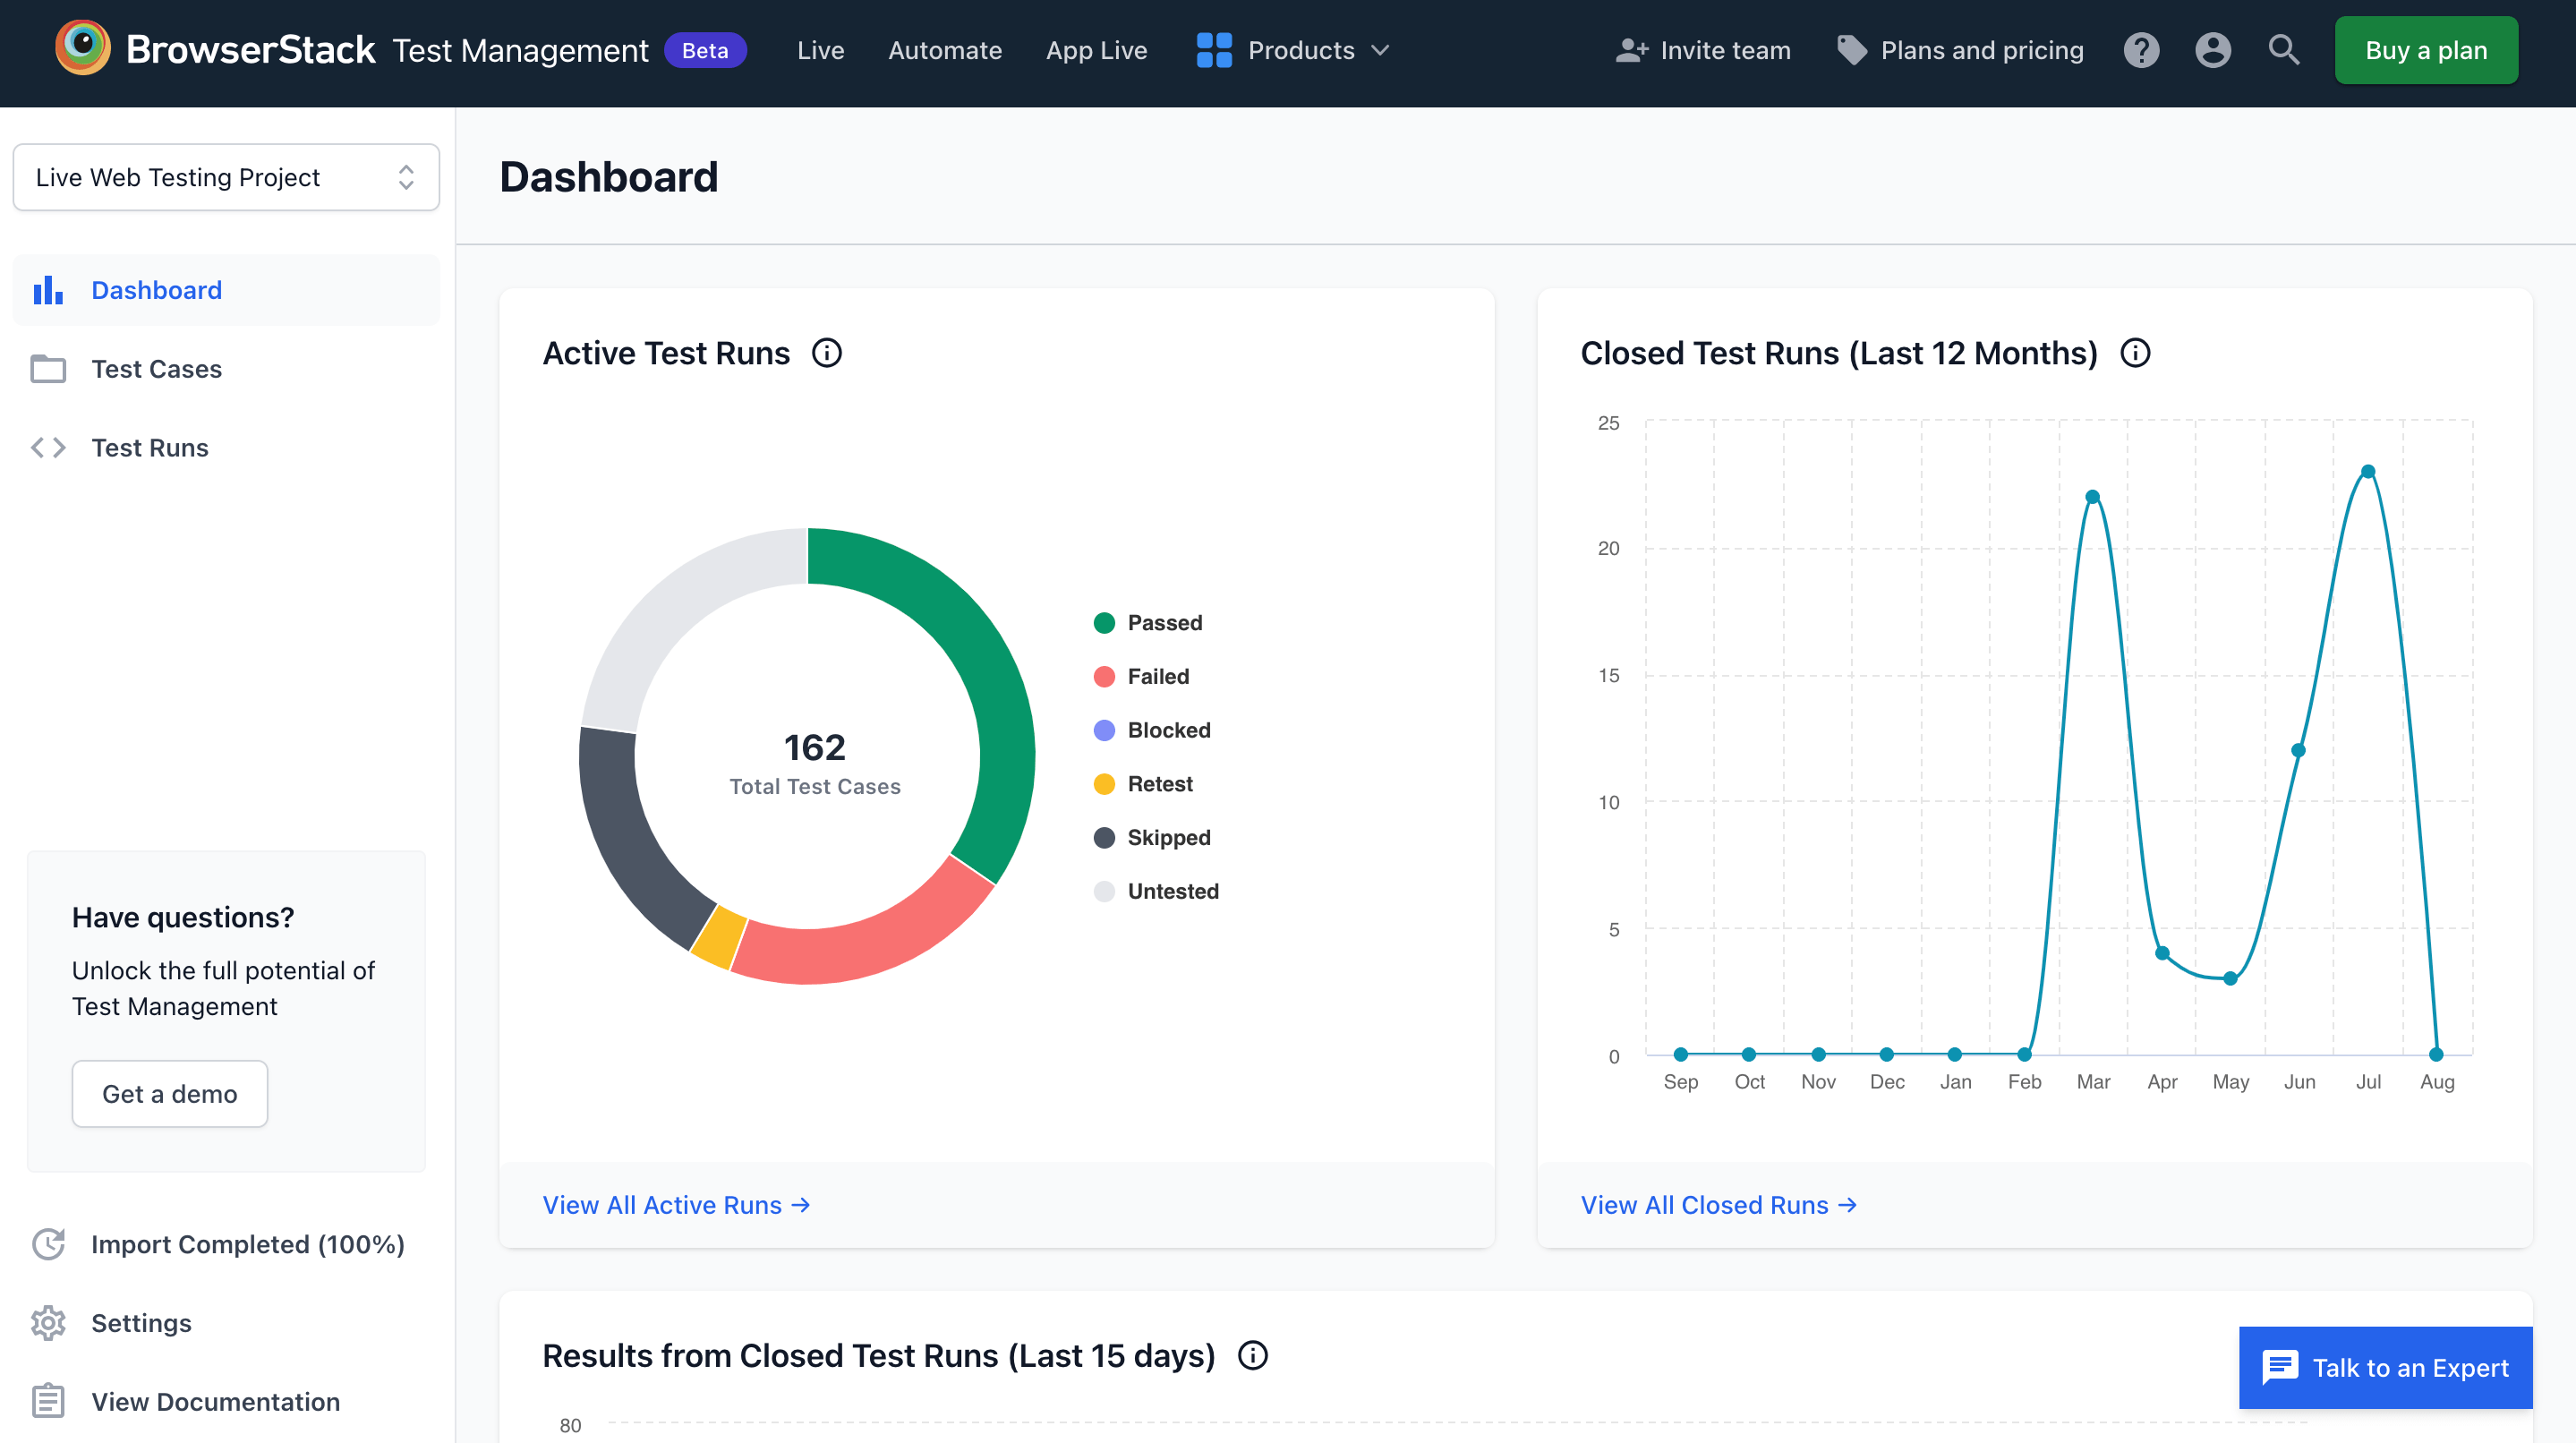
Track Active or Closed test runs
All the active test runs are shown in a pie chart, and all the test runs that have closed are shown in a graph.
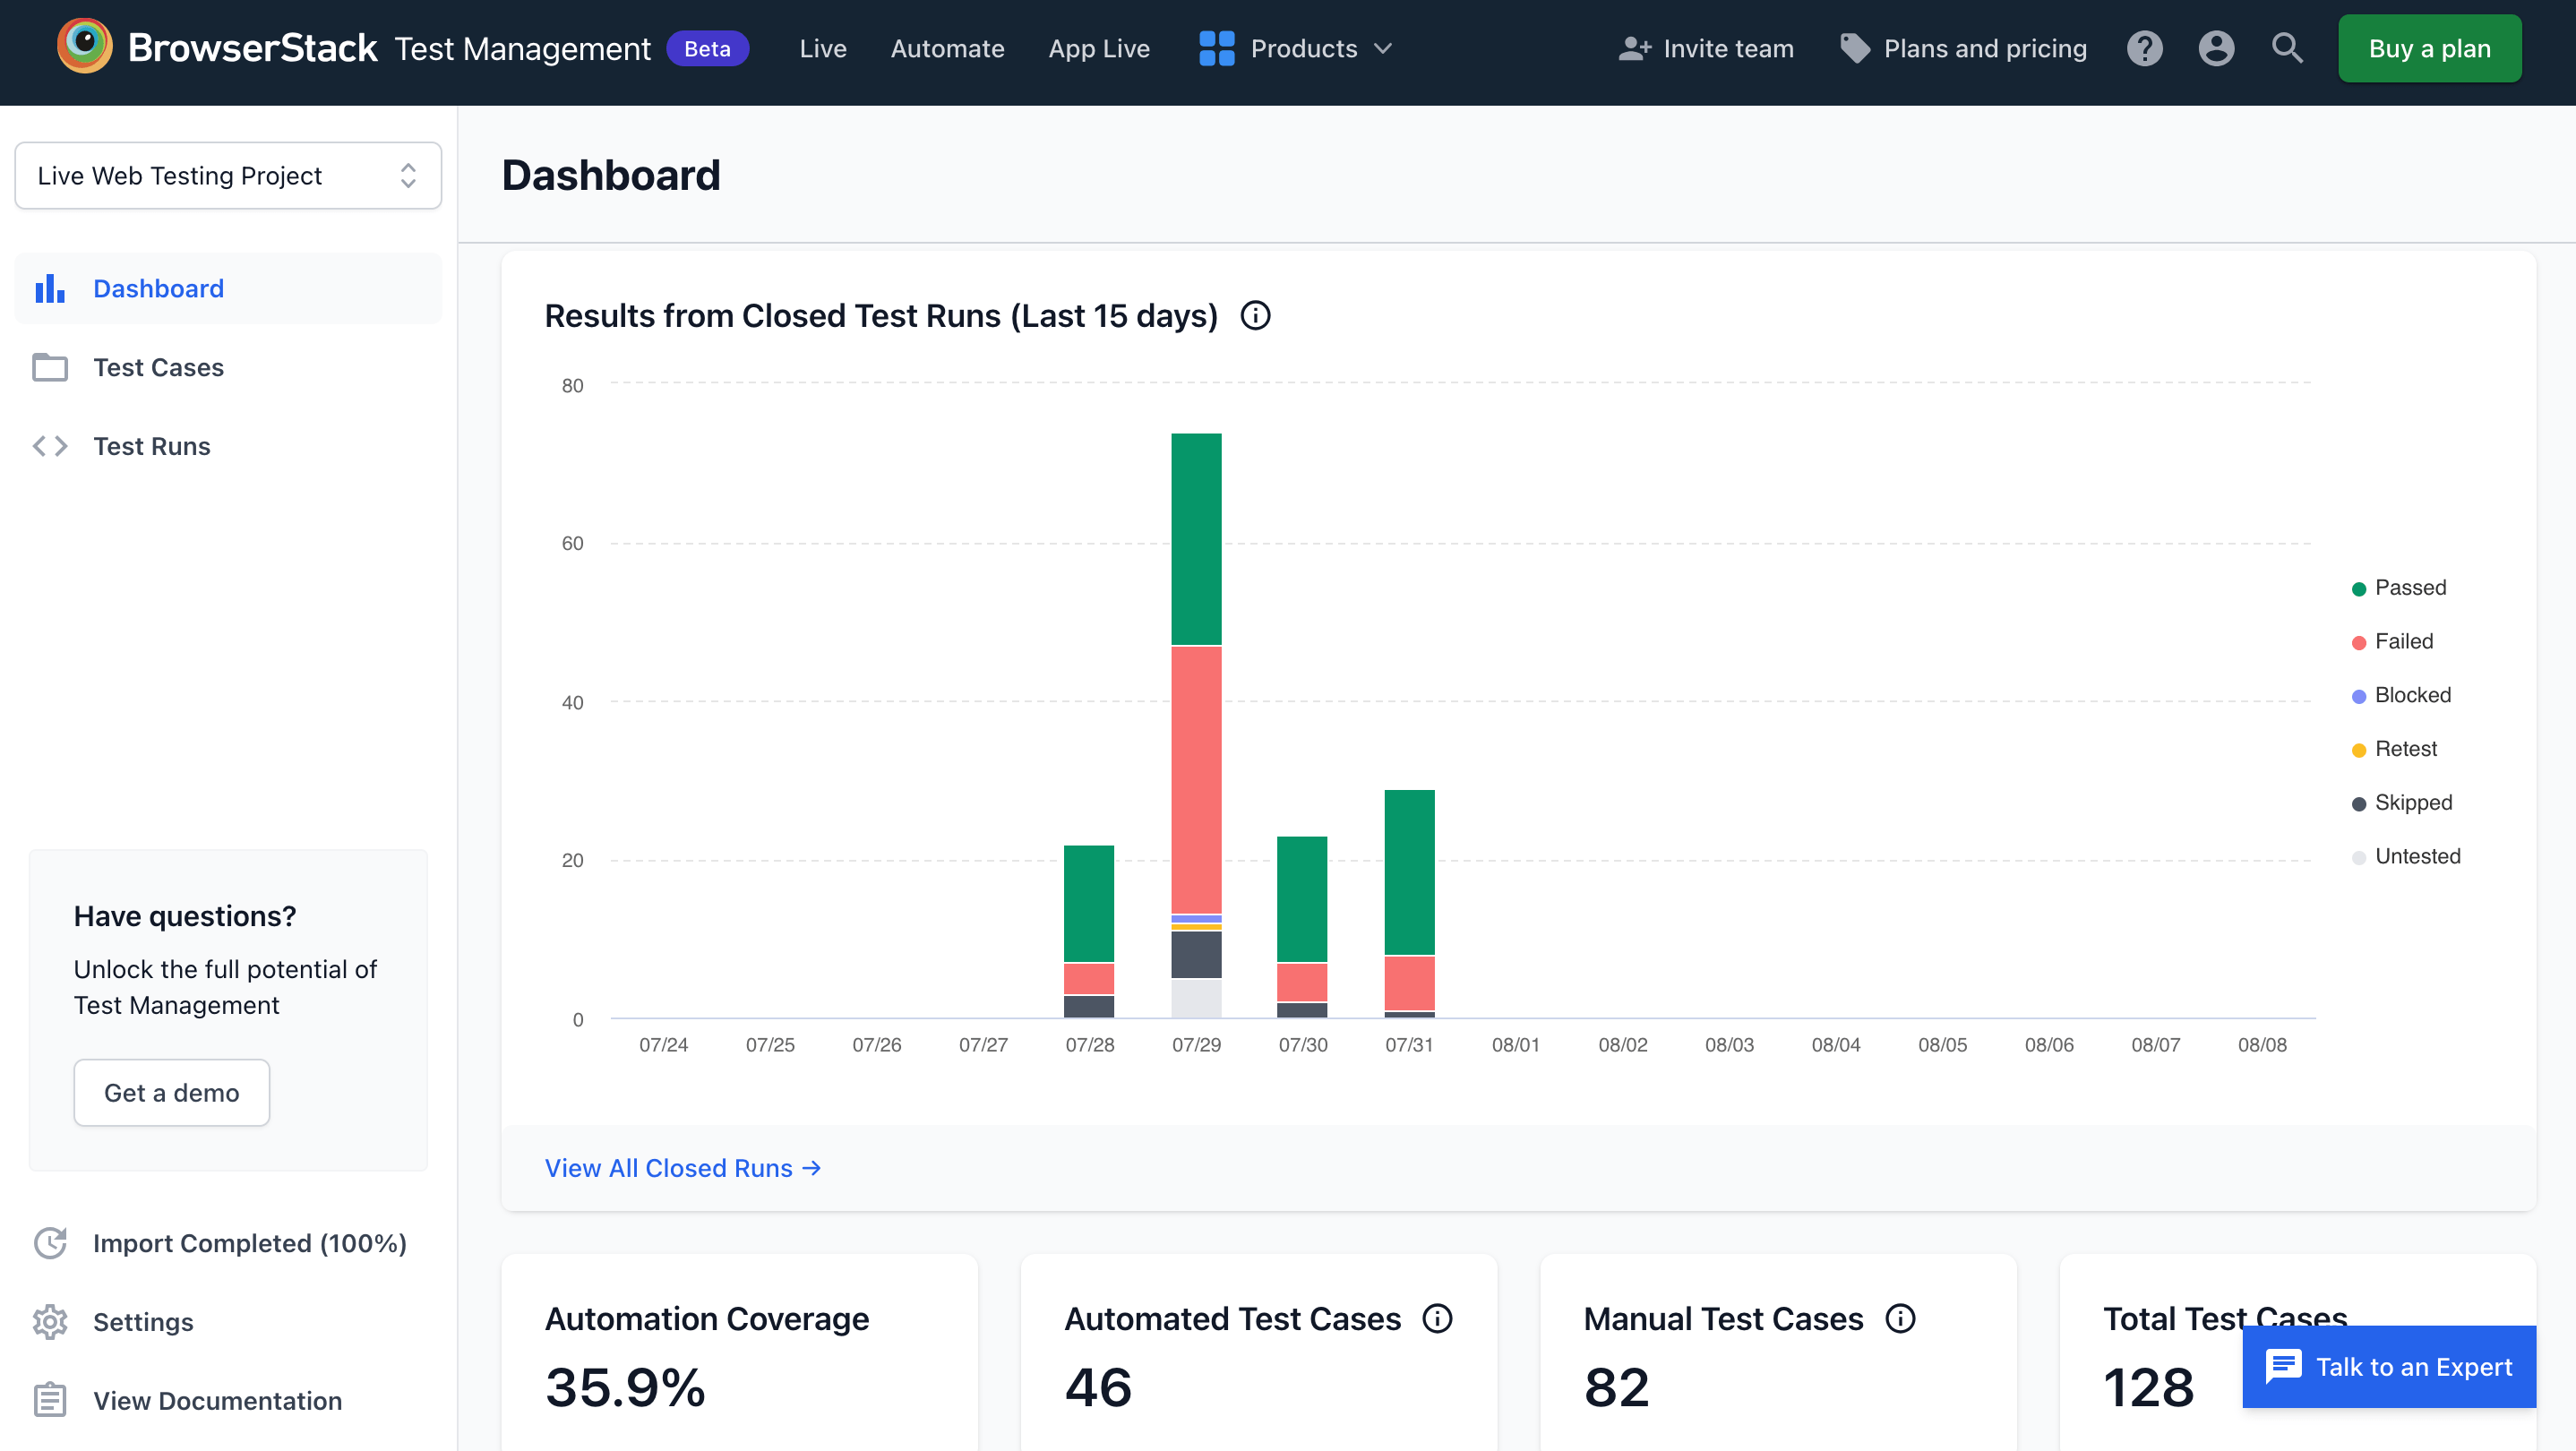
Result Closed test runs
The status of the closed test runs are represented in terms of bar graphs. You also have details like Automation Coverage, the number of Automated Test Cases, the number of Manual Test Cases, and the Total Test Cases of the project.
We're sorry to hear that. Please share your feedback so we can do better
Contact our Support team for immediate help while we work on improving our docs.
We're continuously improving our docs. We'd love to know what you liked
Is this page helping you?
 Yes
No
Yes
No
We're sorry to hear that. Please share your feedback so we can do better
Contact our Support team for immediate help while we work on improving our docs.
We're continuously improving our docs. We'd love to know what you liked
Thank you for your valuable feedback!